
Logs and metrics
The platform monitors itself with its own stack on every node: metrics in VictoriaMetrics, logs in VictoriaLogs, traces in Tempo, alarms through vmalert and Alertmanager.
In the console
Section titled “In the console”| Page | Shows |
|---|---|
| Admin › Substrate › Overview | Health at a glance: nodes, control plane, network, storage, reconcilers. |
| Admin › Substrate › Platform Health | The monitoring pack’s components and dashboards. |
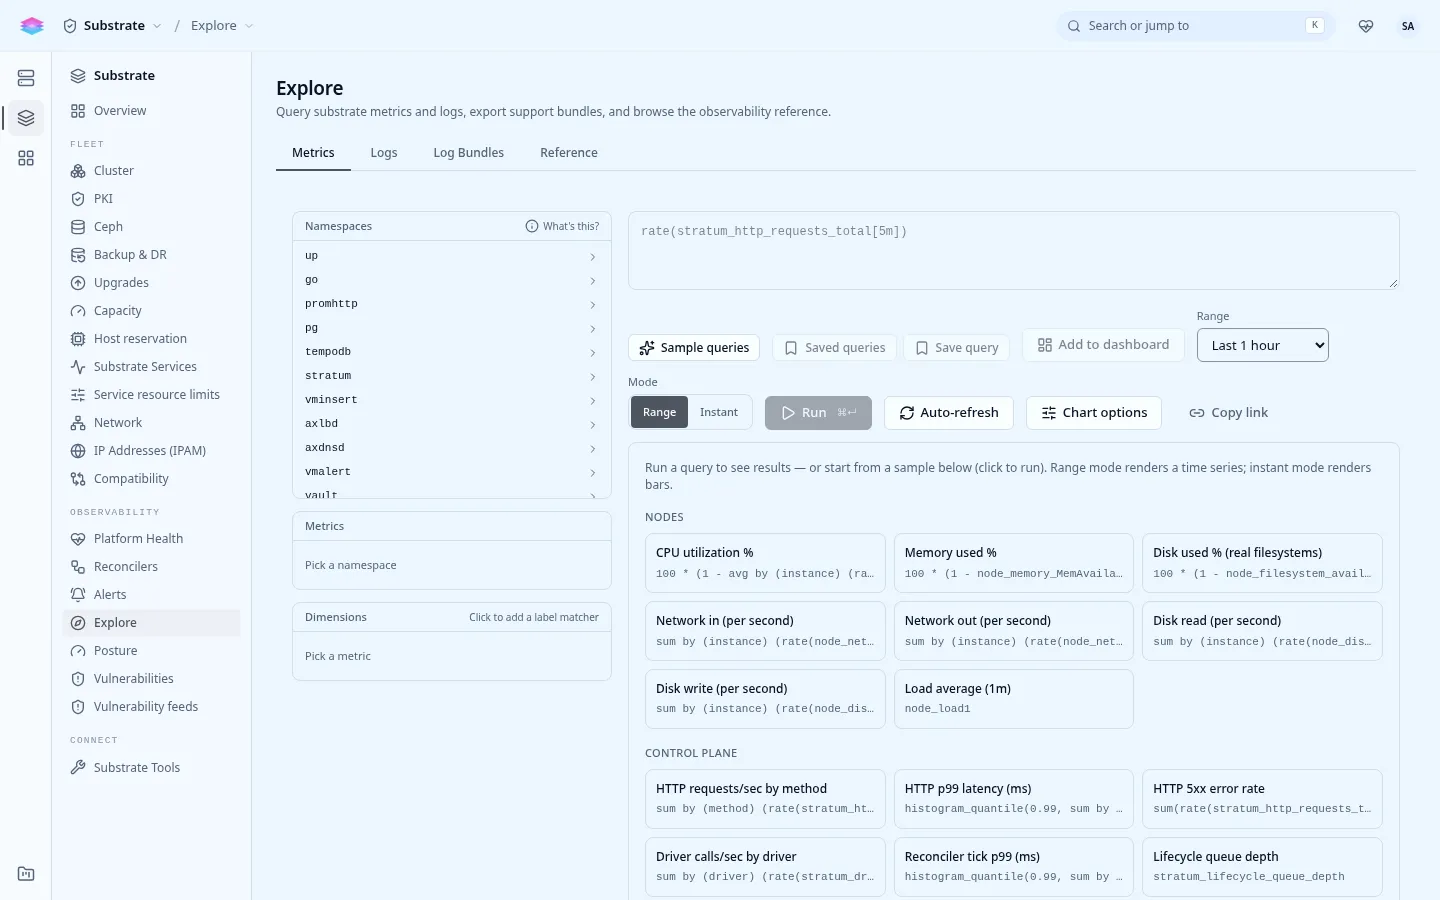
| Admin › Substrate › Explore | Ad-hoc metric and log queries. |
| Admin › Substrate › Substrate Services | Each service’s recent logs. |
| A node under Admin › Metal | Host metrics over 15 minutes to 24 hours. |
On the node
Section titled “On the node”sudo journalctl -u stratum-controlplane -b # a service's log since bootsudo journalctl -u stratum-host-helper --since -1hsudo podman ps # the platform containerssudo podman logs --tail 100 openbaoThe tools behind it
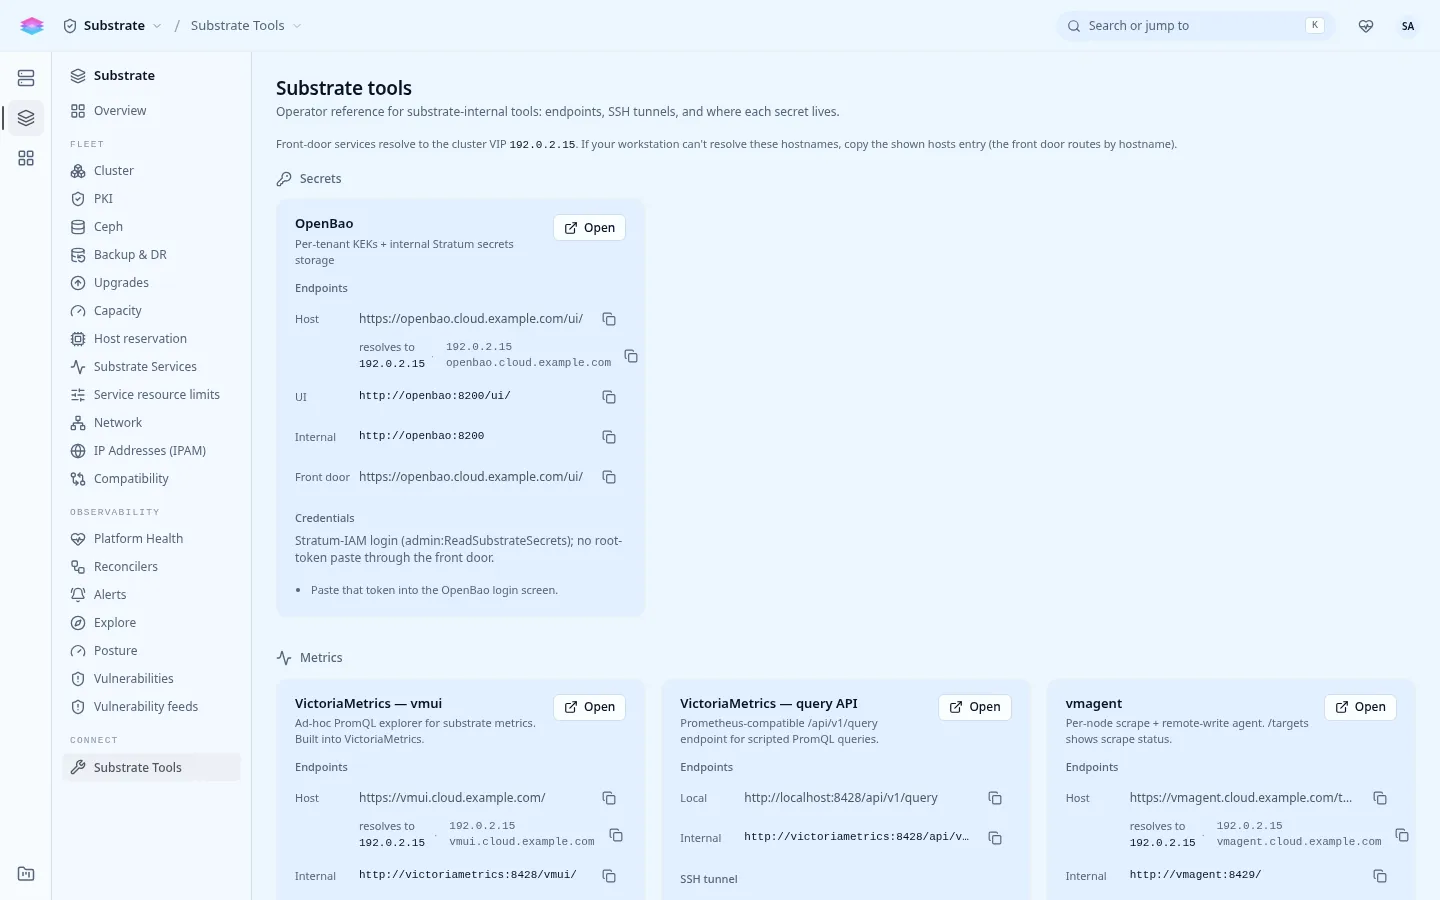
Section titled “The tools behind it”Console: Admin › Substrate › Substrate Tools lists each internal tool with its address and an SSH tunnel command: the metrics query UI (vmui), the metrics API, the scrape agent’s target list, the secrets store UI, the database, OVN and libvirt. With DNS forwarding of the parent domain in place, the web tools answer by name through the front door:
| Name | Tool |
|---|---|
vmui.<parent> |
Metric queries (PromQL). |
vmagent.<parent> |
Scrape targets and their state. |
openbao.<parent> |
The secrets store’s UI. |
The page is limited to the install’s bootstrap administrator.
Metrics from the CLI
Section titled “Metrics from the CLI”The platform’s metrics API speaks the Prometheus query API:
curl -s "https://vmui.cloud.example.com/api/v1/query?query=up" | jq '.data.result | length'